
We create products that are easy to understand and designed to enhance crop growth monitoring capabilities as well as crop yields.
Precision Agriculture Services
Currently, most experienced farmers do not take into account seasonal and even weather forecasts, considering that the experience gained in decades of activity allows them to anticipate the evolution of the weather. Climate change, the effect of which is already visible, has led to a shift in the paradigm in this domain. From now on, almost nothing will be the same as before.
The lack of accurate information on current technological developments and capabilities makes farmers reluctant to assimilate and use the information provided by new technologies, especially those related to data from spectral analysis of high-resolution satellite images. This is why we set out to create products that are easy to understand and to explain the benefits of using them.
Remote Sensing Products
Remote sensing is the science of monitoring the earth’s resources using space technologies for differentiating vegetation, bare soil, and water, monitoring crop growth, and land cover changes. Higher precision accuracy is obtained corroborating remote sensing information with ground observations.
Vegetation indexes, largely used in modern agriculture, are indicators of the amount of photosynthetically active green biomass that exists in the plants. They are computed by spectral analysis of the polar satellite images based on increased reflectivity of vegetation on different wavelengths.
Vegetation absorbs and reflects several wavelengths from solar radiation depending on the plant's health and water stress. The most commonly used indexes in agriculture are the NDVI which describes the vigor of the crop, and NDMI, which describes the water stress.
Normalized Difference Vegetation Index (NDVI)
It is the most commonly used index for agriculture, describing the best vegetation health. With values between -1 and 1, only the positive values (>0) indicate the presence of vegetation.
The values between 0 and 0.4 indicate areas with poor vegetation. Between 0.4 and 1, the more intense the green color, the denser and healthier the vegetation is. Generally, values above 0.2 can be considered as vegetation, and the forest is generally close to 1 during the summer.
Based on Near Infra Red (NIR) reflectance measurements, this index is sensitive to the leaf's internal structure and leaf dry matter content but not to the water content of the leaf.
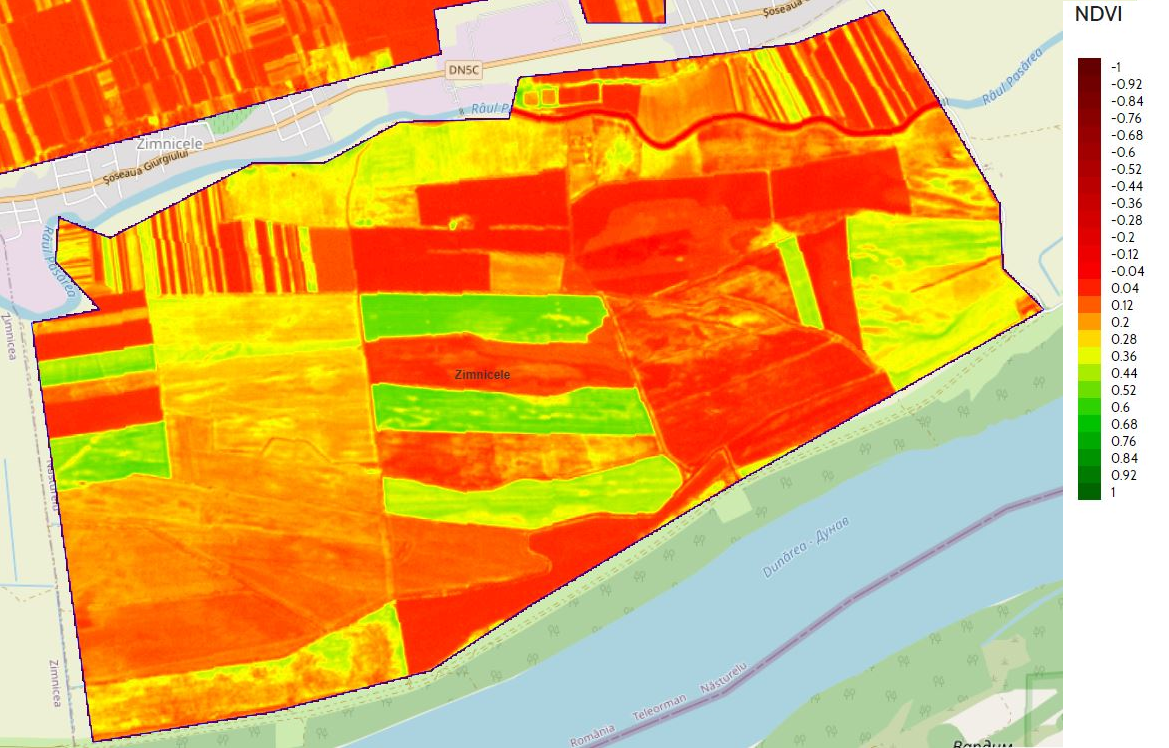
Within a crop, the areas with low NDVI values can indicate the existence of a problem:
either related to the soil if the area had also low NDVI value in the corresponding period of the previous year:
- pH,
- soil compaction,
- drainage,
- obstacles like stones, for example, in the soil,
- drought-prone soil type
or due to:
- vegetation diseases
- insect damage,
- insufficient nutrients: N, K
- mistakes or absence of necessary operations like drilling, fertilizers application, or spraying,
- significant overland water flows determining nitrogen deficiencies.
Benefits
- Remote monitoring is much cheaper than on-site controlling on a large surface
- Early warnings about the restrained areas with problems (lower NDVI) allow farmers to take action on a limited surface only,
- Allows acute problems to be detected and addressed while there is still time for more efficient irrigation control, seed, fertilizers, or pesticide application.
- Possibility of fast and efficient supervision activities in the farms
- Comparing the current maps with those of the corresponding period of the previous year could help to estimate the yield for the current year, assuming that there is the same crop on the parcel or on a neighboring parcel.
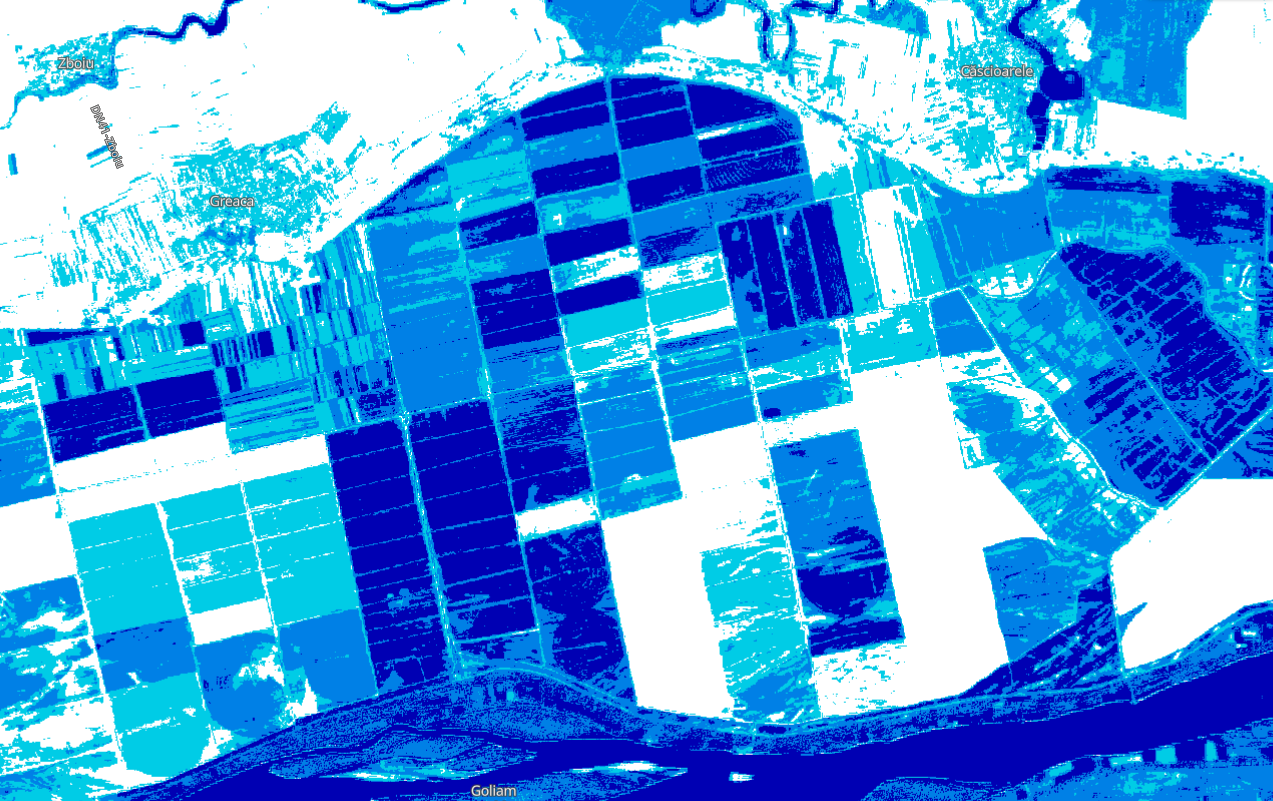
Normalized Difference Water Index (NDWI)
Used to detect and monitor slight changes in water content, NDWI measures the water content of water bodies because they have reduced radiation and strong absorption in the visible and infrared wavelengths. NDWI is suitable for differentiating water from the dry and for mapping the water bodies. Ranged from -1 to 1, NDWI indicates the surface water level. The blue regions represent the water surfaces, and the green the water content in the area. The intense green color means a large amount of moisture.

A surface with darker green than the surrounding area could indicate poor drainage, but to draw that conclusion, the image must be compared with the True Color Image (TCI) because the same greener area could be just the shadow of a cloud. A light green indicating a low water content could be an indication of drought.
Benefits
- An early warning about plant stress due to a low level of water could prevent crop failure or a lower yield if the farmers could use irrigation.
Normalized Difference Moisture Index (NDMI)
The NDMI is mainly useful to detect the crop’s water stress, being a reliable indicator of the moisture level in different areas of the parcels. NDMI depends on the crop variety and its development stage.
NDMI combines both NIR and Short Wave InfraRed (SWIR) spectral channels to reflect changes only in the water content of the leaf as long as the SWIR is sensitive to both leaf water content and the spongy mesophyll structure of the leaf but NIR only to the leaf internal structure.

The NDMI value depends on the type of crop and its phenological stage, that’s why the most important is comparing different values within the same parcel in order to identify problems related to water stress.
Values less than -0.6 means the vegetation is almost absent, values between -0.6 and -0.2 show very low vegetation cover, and between -0.2 and 0 could mean either medium vegetation cover with high water stress or low vegetation cover with low water stress level. Values between 0 and 0.8 are proportional to vegetation cover and level of water stress, from medium cover with high water stress to full vegetation cover with no water stress.
Benefits
- extremely useful in monitoring irrigation, especially in the areas where the crops need more water to grow than is available from nature.
- NDMI could be a better deforestation indicator than NDVI due to a less abrupt decrease in values.
NDMI for moisture Stress (NDMI-S)
Derived from NDMI, this index can be mainly used for determining if a certain parcel has been irrigated or not. The color palette has only four classes allowing us to differentiate between productive and non-productive surfaces as long as we have knowledge about the land cover and land use.
Benefits
- useful for tracking up the concessions of water resources used for irrigation.
- if one knows the type of crop, it’s possible to determine if the irrigation was effective or not during the growing season.
True Color Image (TCI)
Obtained by a combination of wavelengths from the visible spectrum, TCI colors are very close to the ones seen by the human eyes. TCI is a visual interpretation of the Earth's coverage.

Benefits
- These high-resolution images are mainly used to confirm different conclusions that are obtained by analyzing the other images described above, for example, to check if a darker green area in a middle of a parcel, as seen in an NDWI image, indicates an excess of water or it is only the shadow of a cloud.
Enhanced Vegetation Index (EVI)
Rather similar to NDVI, this index is supposed to minimize the influence of atmosphere (aerosols, cloud cover, and cloud shadow) and soil (brightness and color) influence in the index value and also to avoid situations like dense canopy zones when NDVI reaches saturation.

Benefits
- For healthy vegetation, the EVI value varies between 0.2 and 0.8
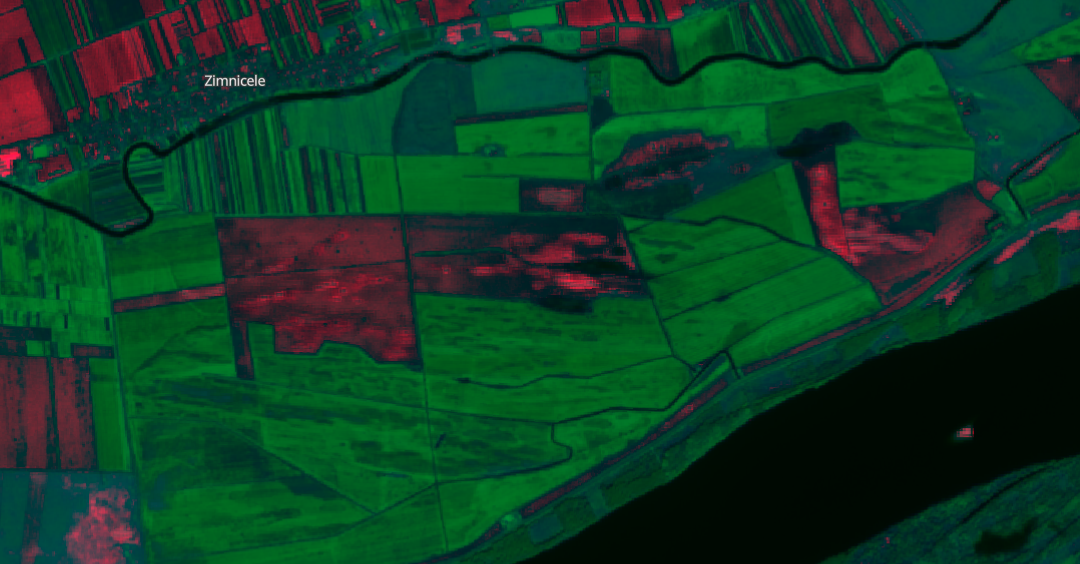
Barren Soil Index (BSI)
In these images, all vegetation appears in green and barren ground in red colors. The water appears black. In urban areas, it’s difficult to differentiate between dwellings and bare ground surfaces.
Benefits
Displaying the barren ground in red and vegetation in green, the information provided by BSI can be used to:
- figure out the status of the crops (growing, not yet growing),
- detect recent deforestation,
- monitor droughts
Weather Forecast Products
Agricultural activities are weather-sensitive, and it would be inefficient not to use climatological and meteorological information.
We provide hourly forecast and daily computed values (min, max, mean) for the next 7 days for the following parameters significant for agriculture:
- In soil (0-10cm), temperature and humidity
- Soil surface temperature
- Solar radiation
- Evapotranspiration (ETo) and leaf wetness index (LWI). Evapotranspiration is an estimate of the loss of water from both plants and the soil and is mainly driven by sunlight, wind, humidity, temperature, and mean sensible heat flux. It is a very important part of scheduling irrigation in order to maintain soil moisture for optimum growth rates and yields. The main use of LWI is in fungus and disease management schemes.
- 2m temperature and relative humidity, air pressure, 10m wind speed and direction, and the weather symbol
- precipitation (rain, snow, ice, hail, and showers), the distribution of precipitation around the location
The above parameters are presented in a user-friendly and easily understandable form.
For the most common agriculture activities, we produce a farm calendar indicating in a qualitative manner (suitable, less suitable, unsuitable):
- Suitable conditions for sowing for different crops (maize, wheat, barley, rapeseed, potato, sugar beets, soybean, cotton, rice indica, rice japoni, sorghum). The computation uses the forecasted minimum soil temperature for each crop type and the precipitation accumulated in the previous time interval.
- Suitable conditions for spraying (wind and showers are totally inappropriate for spraying, for ex), calculated from wind, precipitation, temperature, and humidity.
- Soil trafficability for different types of soil (sand, silty loam, silt, clay) means the capacity of the soil to support moving vehicles. Computations take into account the soil type, the amount of precipitation, the sunshine hours, and the evaporation of soil water.
These recommendations can be adapted to local conditions and land management through experience. For important decisions, frequent comparisons with local observations should be carried out.
Benefits
The farm calendar allows efficient planning of activities on the farms (the weather conditions are suitable or not for different activities). For example:
- The spreading of pesticides will succeed if the weather is moist and warm (not hot) and not very rainy or windy.
- Hay should be made before a period of several dry days so that the hay has enough time to dry.
- The harvesting of wheat is also most effective during a dry period.
- If the wheat is threshed while it is damp, it becomes predisposed to damage.
- The fungus disease develops when the temperature is low, the weather is cloudy or lightly rainy, and the leaves of the plant are wet.
- Soil moisture information helps farmers to schedule irrigation properly
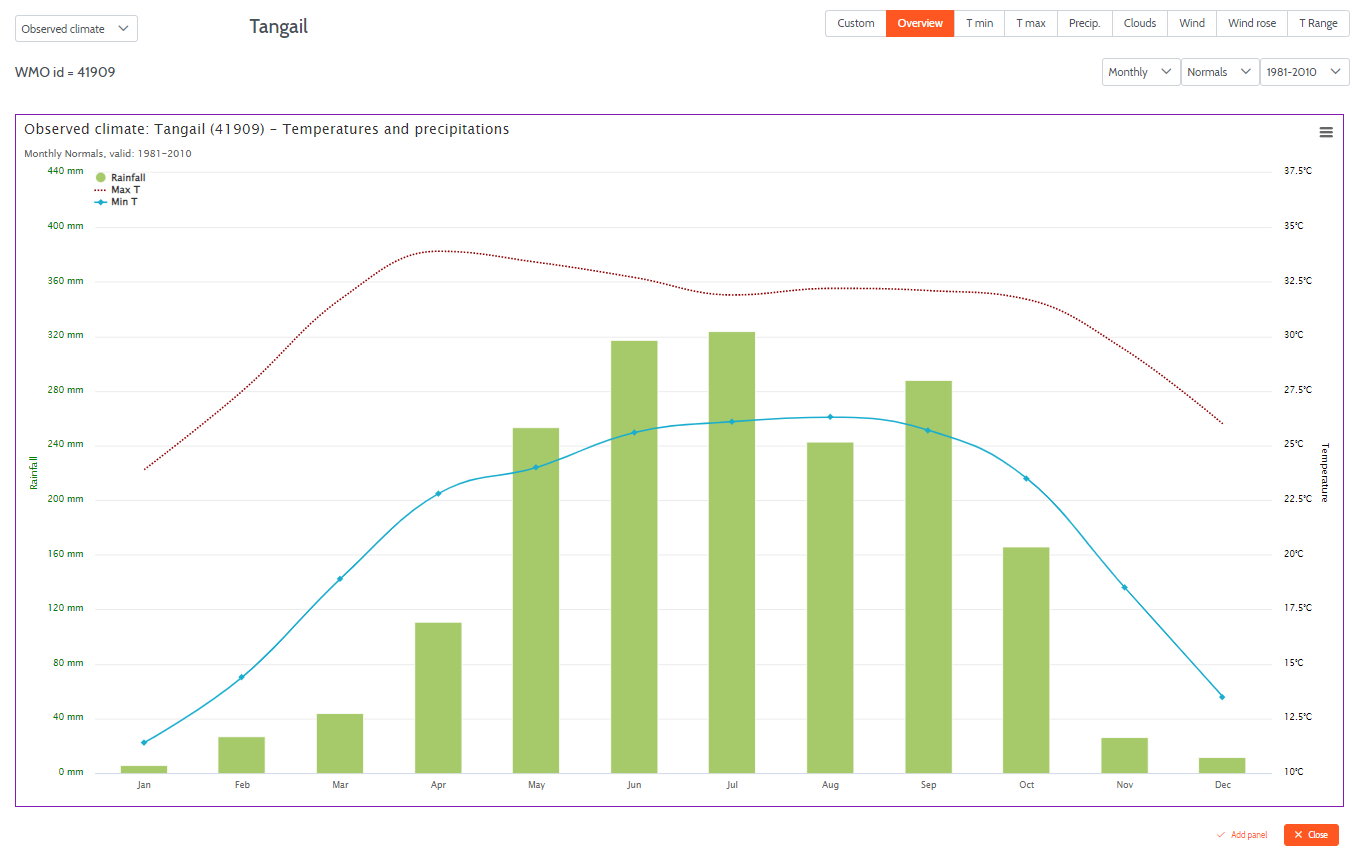
Climatological products
Agrometeorological information, in practice mainly climatological data, is essential in planning agricultural production.
We are providing climatological charts for the most important parameters for agriculture based on measurements and numerical model analysis data for the last 30 years:
- Average temperatures and precipitation
- Minimum and maximum temperatures
- Cloud cover and precipitation amounts
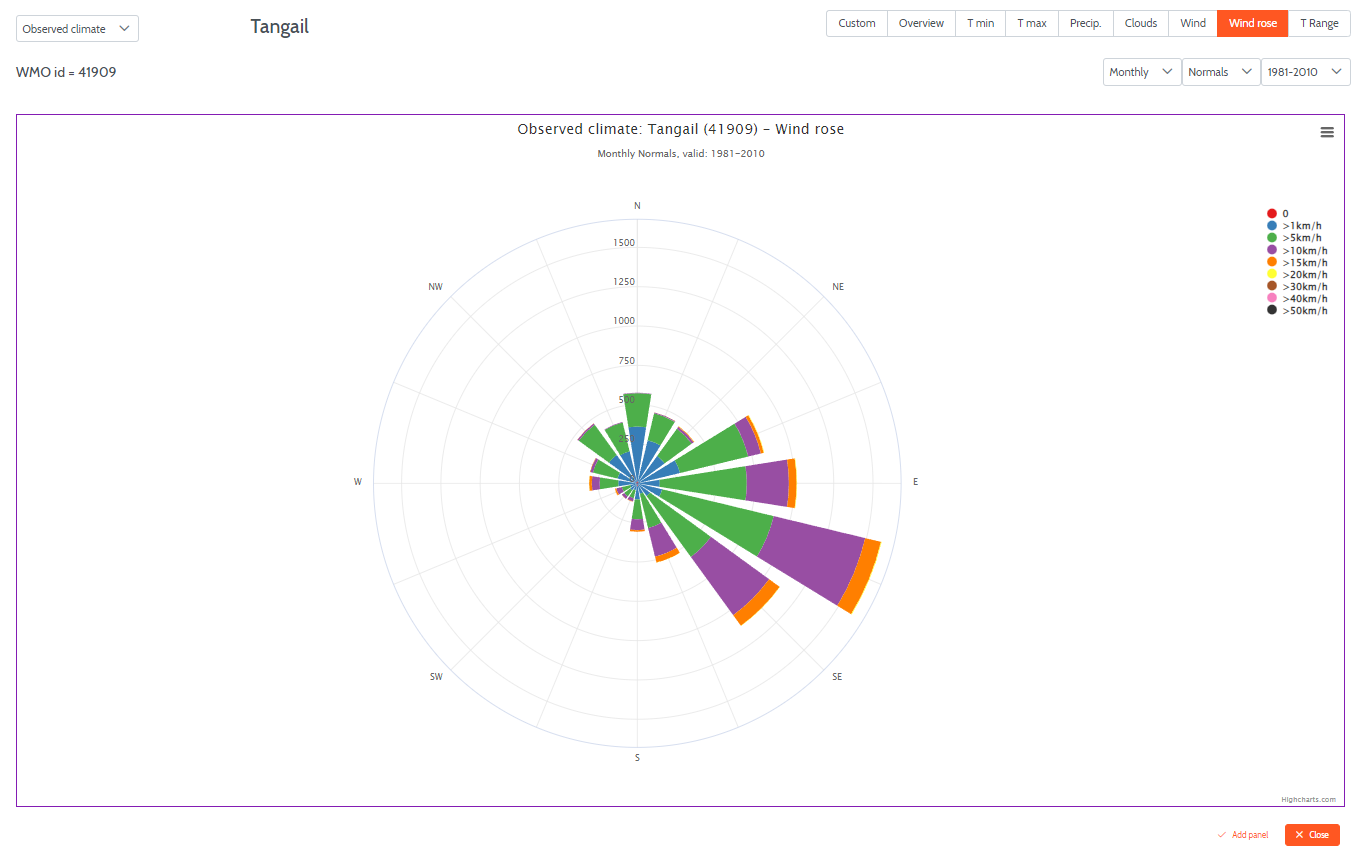
- The wind rose (a graphical representation of the wind speed and direction distribution calculated over the entire climatological interval)
For comparisons, the climatological parameters in the form of minimum, maximum or average values can be computed on shorter time intervals (last three years, last ten years, etc.)


Benefits
The following decisions should not be made without knowing climate conditions: land use and management, selecting plants and breeds of animals, and crop production practices such as irrigation, pest and disease control, and crop-weather relationships.
- To give recommendations about land use, first, we need to quantify the environmental conditions, and at least the following parameters are required: the monthly rainfall data, solar radiation, temperature, and climatological risks (frosts, hail, etc.)
- To select plant species or varieties, a prior agro-climatologic characterization is required based using weekly, daily, and hourly temperature, rainfall, solar radiation, evaporation, wind speed, evapotranspiration, and relative humidity
- To assess the suitability of an environment for animal production, knowledge of the effects of radiation, wind, precipitation, temperature, and relative humidity is essential
Seasonal forecast
We are providing a seasonal forecast based on local adaptation of the climatological model data. The parameters are presented on the chart, including:
- Minimum temperature
- Maximum temperature
- Precipitation amount
- Growing Degree Days (GDD)
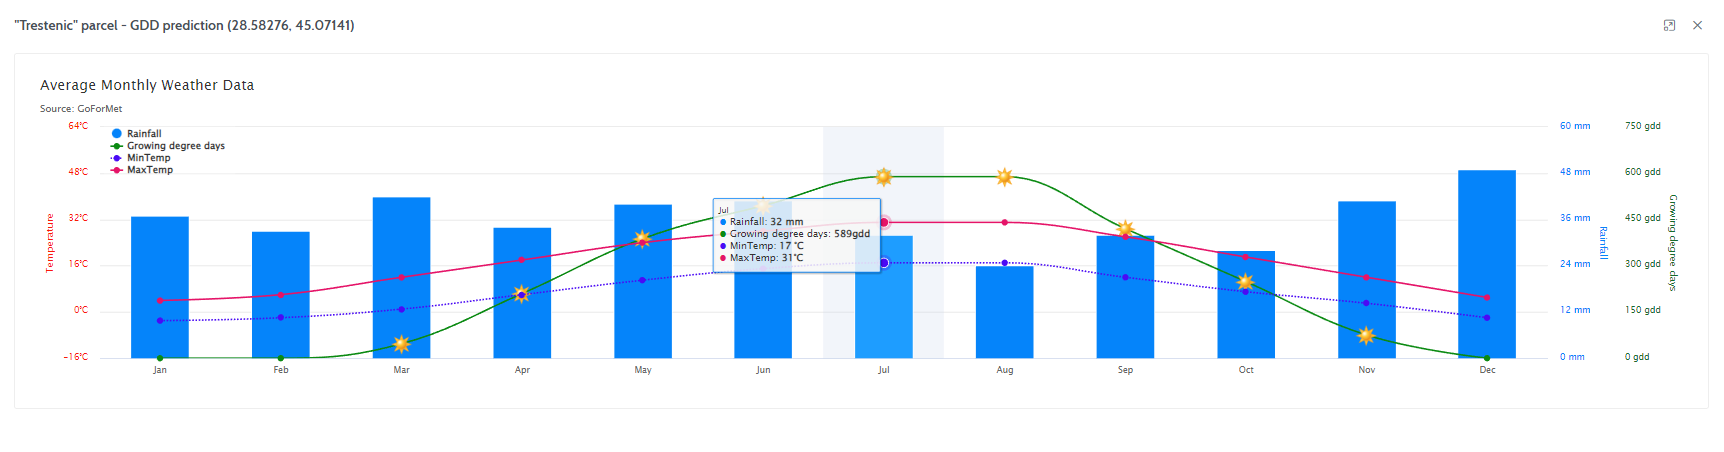
GDD is the most reliable parameter for predicting crop and pest development during the growing season. It roughly represents an accumulation of daily heat, computed as the difference between the average daily temperature and a minimum temperature value that is specific to each crop (insect). Starting from the sowing date, the GDD chart predicts the periods when the plant's rich different growth stages. Similar charts are provided using real measured data for the previous years (historical data) and until the current day.
Benefits
- For pest management and plant diseases, the minimum weather data set required should consist of temperature, humidity, and accumulated heat (GDD). Moisture (relative humidity, rainfall, and wetness duration) is essential in most plant disease prediction schemes and for predicting outbreaks of some insect pests.
- With seasonal forecasted data is possible to anticipate bad weather conditions and to be more prepared to minimize the damages.
Historical Data Analysis Correlated With Crops And Yield
We provide an easy-to-understand graphical format comparison analysis for different weather parameters combined with crop and yield data.
Remote sensing products are also available on request for different comparisons.
Benefits
- Analyzing on the same charts the correlations between weather parameters such as temperature and precipitation with the previous year's yields allow farmers to plan future actions such as irrigation plans, especially if they take into account the seasonal forecast as well.
- Information about the crop's status from NDVI corroborated with the seasonal forecast for temperature and precipitation could help a better estimation of current-year yields.