Through the End-user-lab module, GoForMet provides our professional clients with a platform capable of processing all the existing meteorological information, both in the form of web content and in media format appropriate to be run and broadcasted from TV newsrooms.
GoForMet-Media
The End-user-lab is a tool that allows users to insert weather and environmental data, maps, and charts in their articles would be a useful resource for journalists, researchers, and other individuals who need to incorporate data into their written work.
This tool could be accessed via a website or mobile, allowing users to search for and select the specific data, maps, and charts they want to include in their articles. This module could provide a range of data sources, including government agencies, research organizations, and other reliable sources, to ensure the accuracy and credibility of the information.
The End-user-lab could also provide various formatting options, such as different chart types and map projections, to help users customize the data to fit their needs. Overall, this tool would provide a convenient and user-friendly way for individuals to incorporate data into their written work.
Using the GoForMet weather and environmental data access and the high-resolution satellite imagery available, with the help of Artificial intelligence, a media article can be written in minutes. We present two examples below on topics of great interest.
Chile's drought
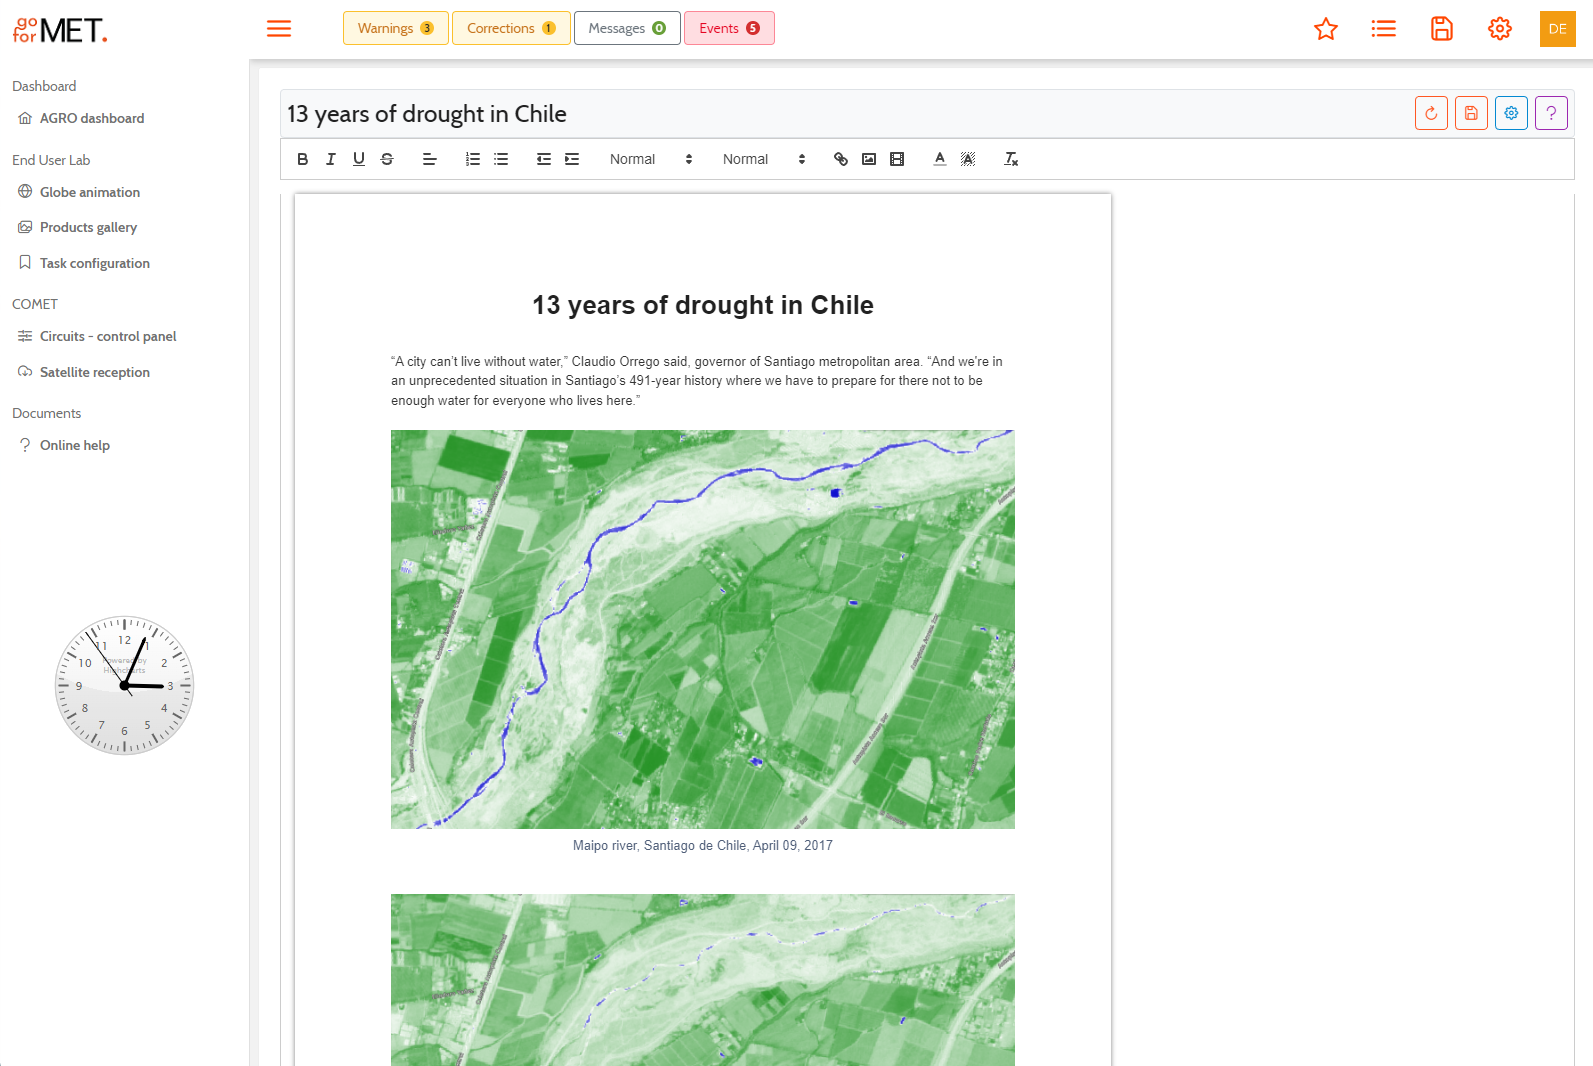
Chile is experiencing its worst drought in over 30 years, with some areas having gone without significant rainfall for more than 13 years. This prolonged drought has significantly impacted Chile's economy, environment, and society.
The drought has caused water shortages, particularly in northern Chile, where most of the country's agricultural production occurs. This has reduced crop yields and increased food prices, affecting farmers and consumers. The drought has also negatively impacted Chile's hydroelectric power generation, as low water levels have reduced the amount of electricity that can be produced.
In addition to the economic impacts, the drought has also had environmental consequences. The lack of water has caused vegetation to die off, leading to increased wildfires and soil erosion. The drought has also negatively affected Chile's wildlife, with many species facing reduced habitat and food availability.
Siberian Oil Spills
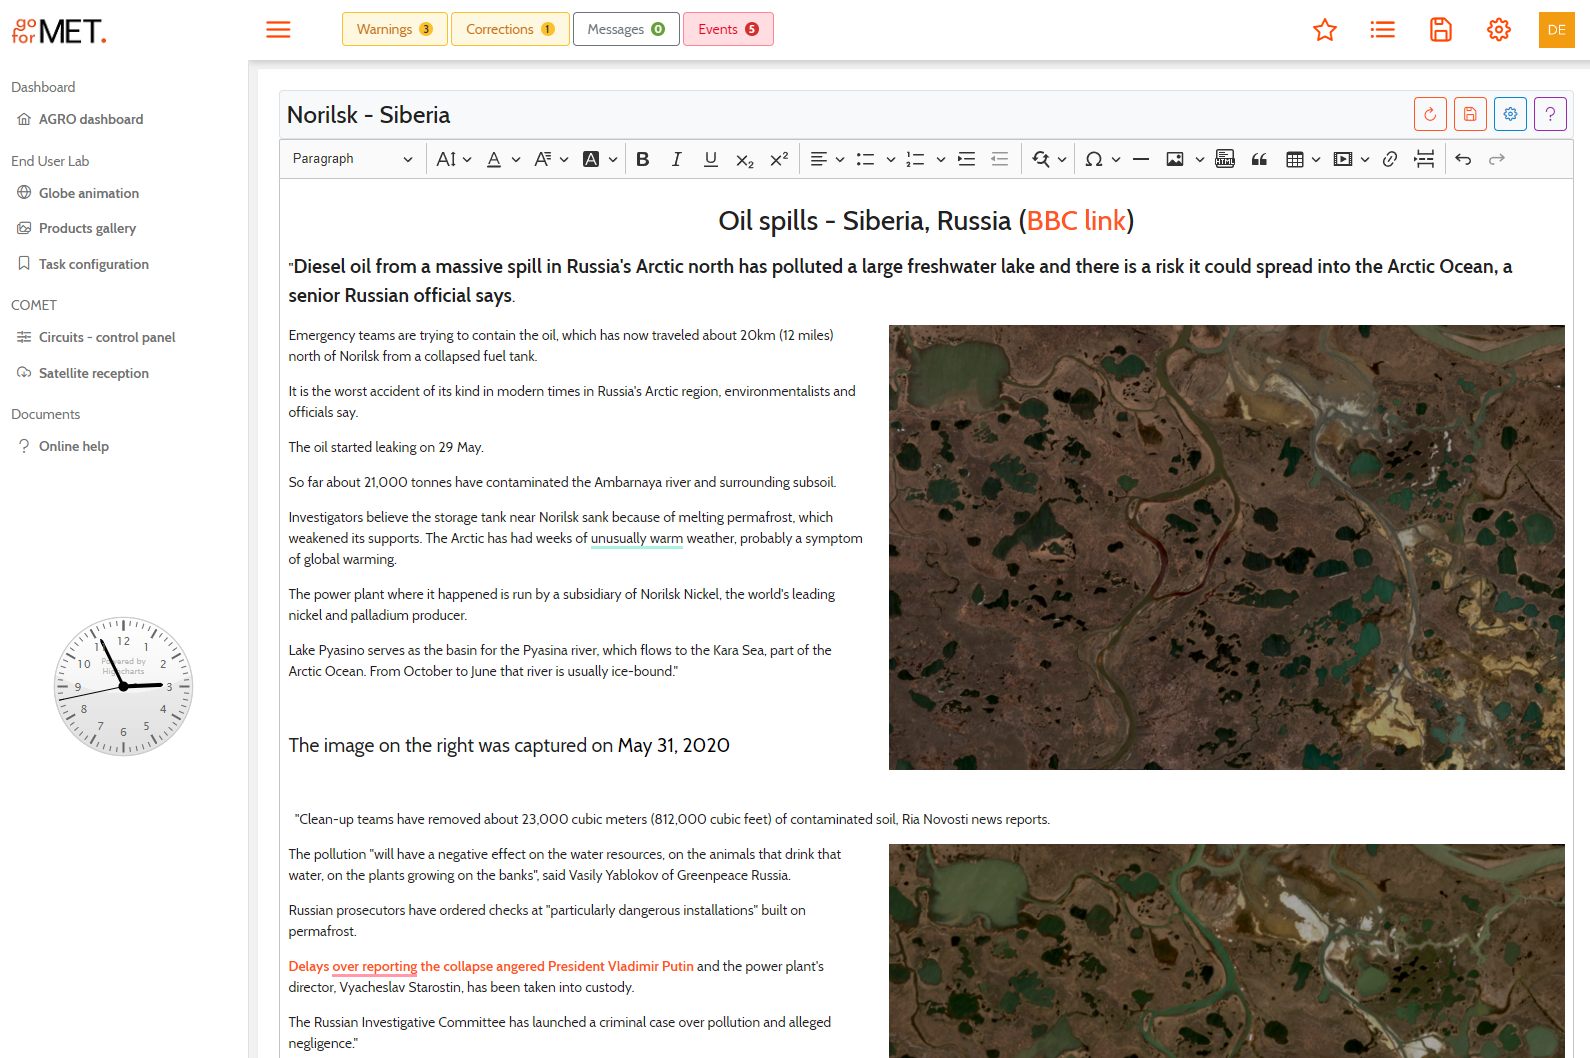
Siberia is a vast northern Russia region home to several oil and gas fields. In recent years, there have been several diesel oil spills in Siberia, which have caused significant environmental damage and impacted local communities' health and livelihood.
One of the most notable diesel oil spills in Siberia occurred in May 2020, when a fuel tank at a power station near Norilsk ruptured, releasing over 20,000 tons of diesel oil into a nearby river. The spill contaminated the water supply for the city, which is home to over 100,000 people, and also affected a nearby nature reserve. The cleanup efforts were hampered by the remote location of the spill and the difficult conditions in Siberia, and the environmental impacts of the spill are expected to last for years. Overall, diesel oil spills in Siberia have had serious environmental and health consequences, and efforts must be made to prevent future spills and mitigate their impacts.
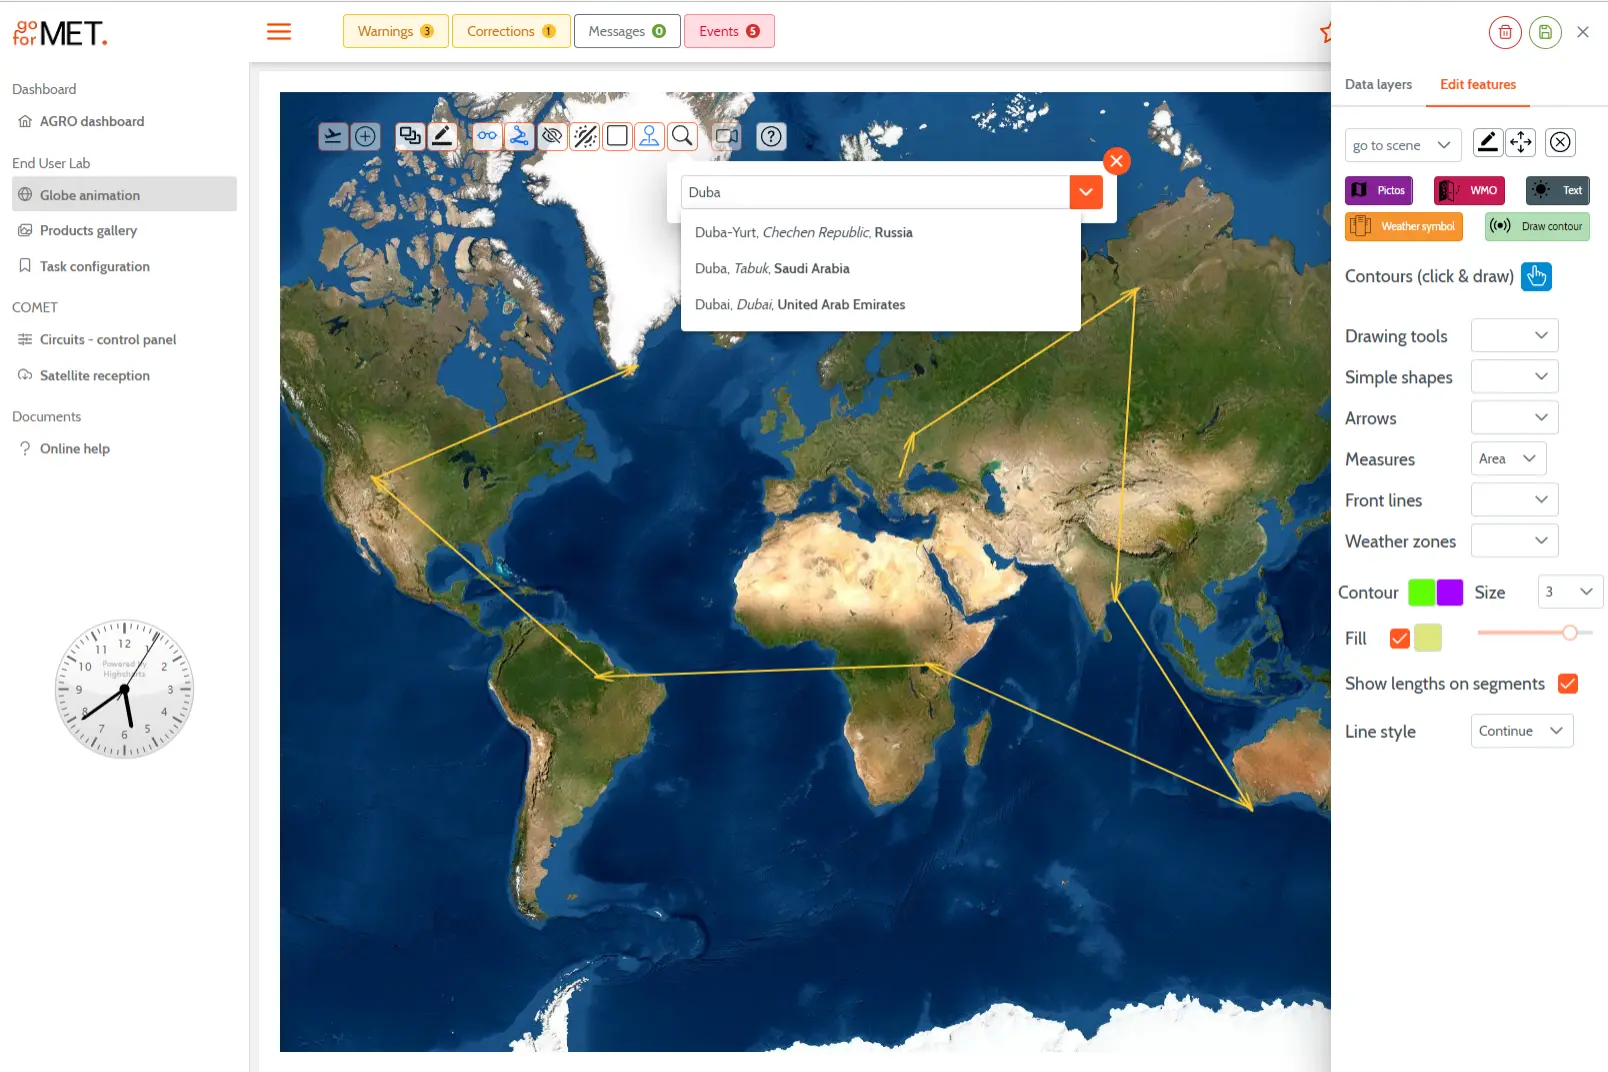
The End-user-lab has a flyover capability, a very useful tool for visualizing and understanding data about the Earth's environment. It allows users to view data about specific locations by "flying" over them in a virtual environment. The module would use satellite imagery and other data sources to create a realistic representation of the location and allow users to zoom in and out to see different levels of detail.
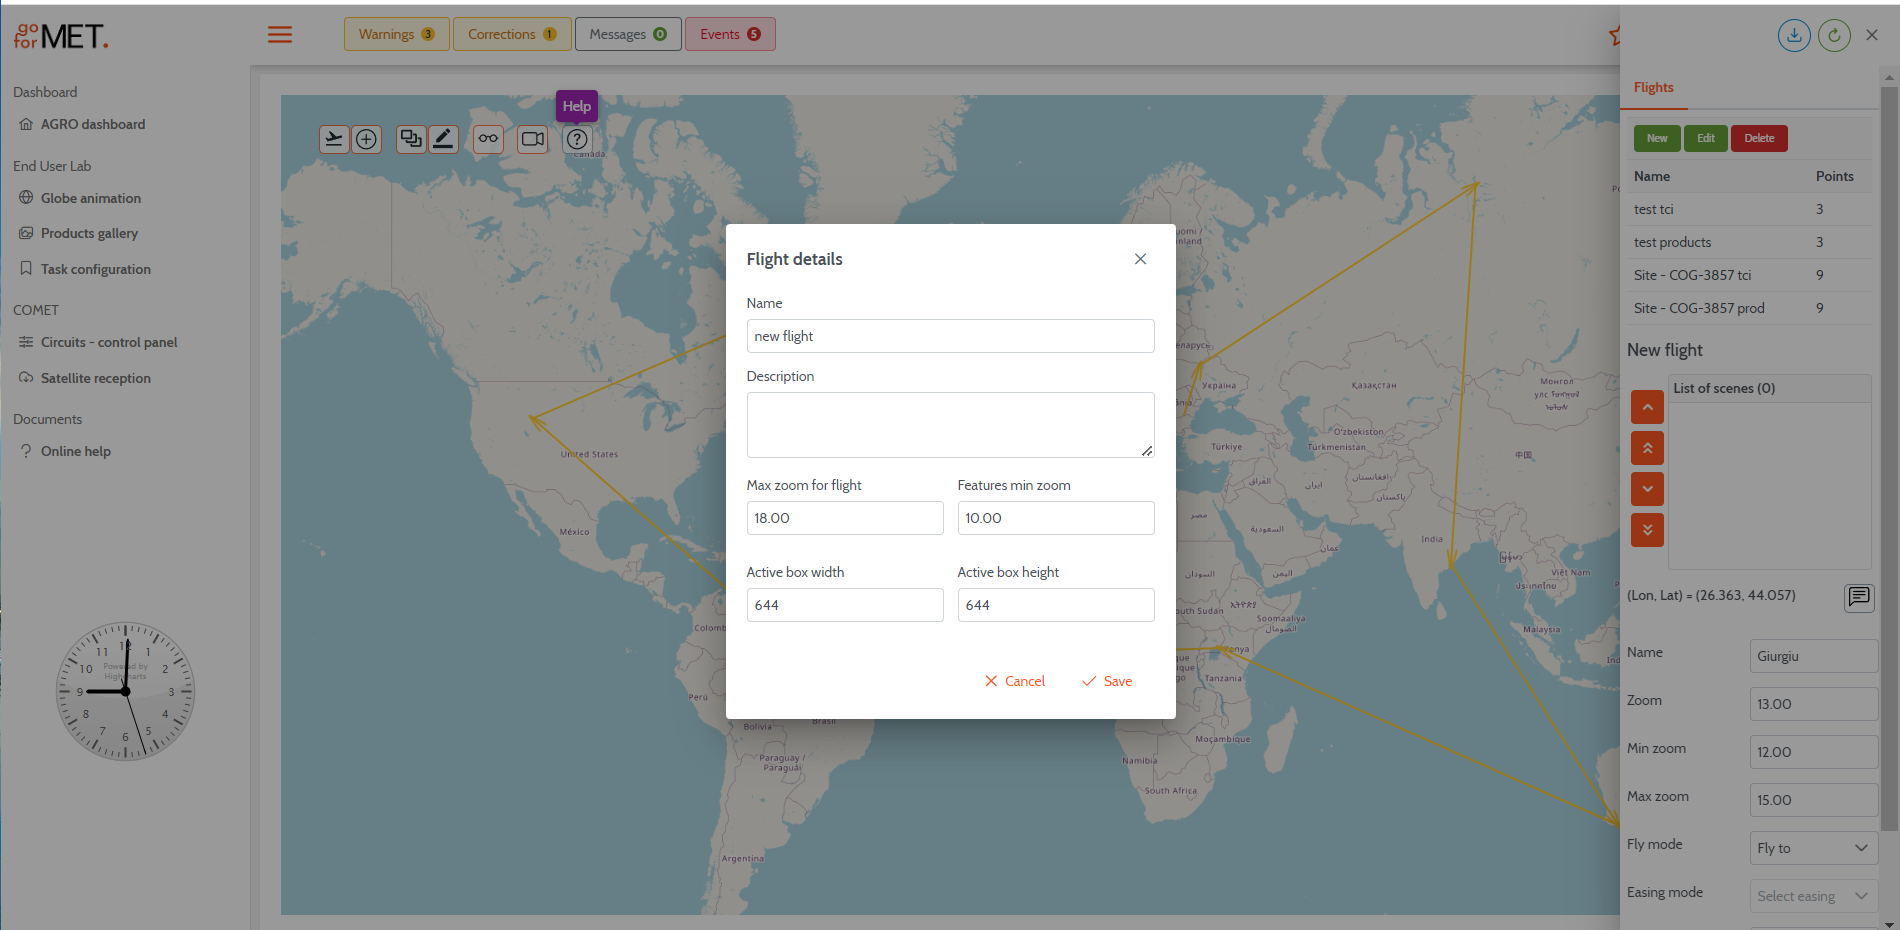
The flyover capability would allow users to see how the data varies across the landscape and provide a more intuitive and interactive way to explore the data.
The Amazon rainforest is the largest tropical forest in the world and is home to a rich diversity of plant and animal species. In recent years, however, deforestation has threatened the Amazon, as more and more of the forest is being cleared for agriculture, mining, and other activities. High-resolution satellite imagery has emerged as a valuable tool for monitoring and tracking the extent of Amazon deforestation and can be used to monitor the extent and rate of deforestation and to identify areas that are at risk of being cleared.
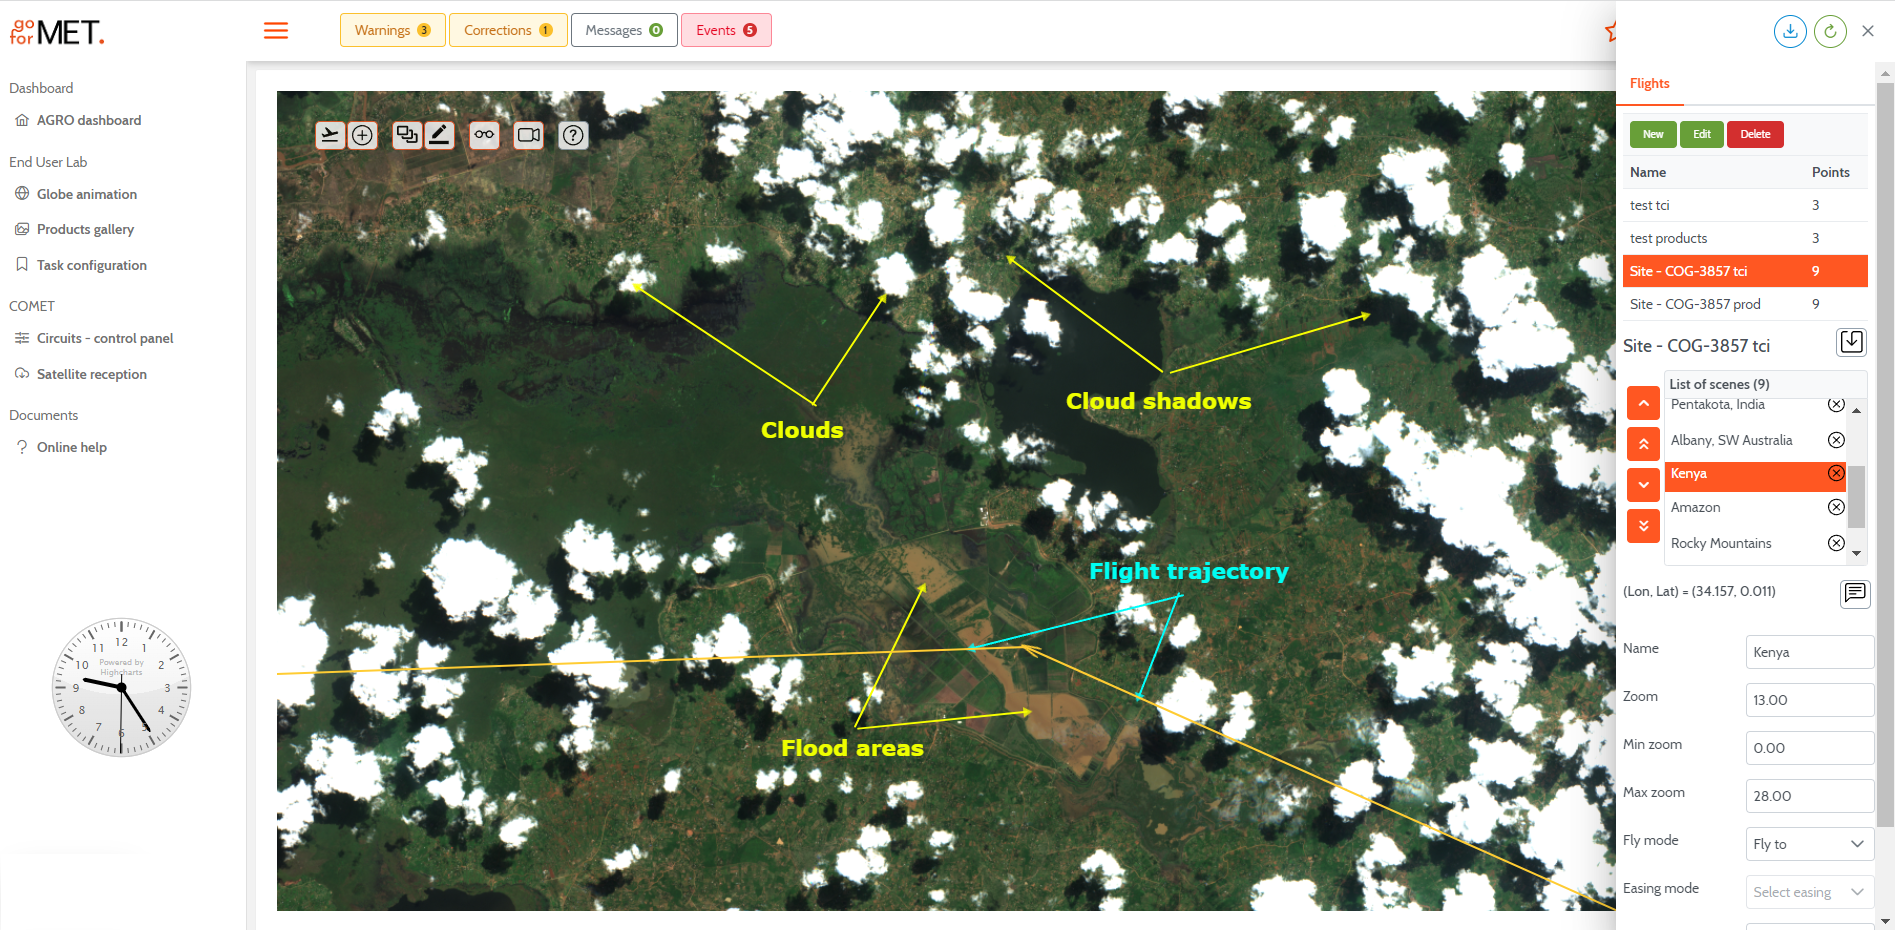
End-user-lab provides a valuable image annotation tool for anyone who needs to add notes, labels, or measurements to images. Whether working with maps, scientific diagrams, or other types of images, this module can make annotating and analyzing images faster and easier.
This can be useful in various scenarios, such as annotating maps to measure distances and areas or adding notes and labels to scientific diagrams. The module would likely have a simple user interface that allows the user to choose an image to annotate. Once the image is selected and overlaid on the map, the user can then use a variety of drawing tools, such as lines, circles, and text boxes, to add annotations to the image. These annotations can be customized in terms of color and thickness and can be moved, resized, and deleted as needed. In addition to basic drawing tools, the module may also include specialized tools for working with maps. For example, the user could use a ruler tool to measure distances on a map or use a protractor to measure angles. It also includes a tool for calculating the area of a region on a map, allowing the user to quickly and easily determine the size of a particular area.