
Forest monitoring is based on a complex process of computation of NDVI - Normalized difference vegetation index) - from very high-resolution satellite images over a long period of time.
Forest Monitoring Services
Forest monitoring is the practice of using various tools and technologies to monitor the health and condition of forests. One of the tools that are often used in forest monitoring is high-resolution satellite imagery. This type of imagery provides detailed, up-to-date information about the state of forests, allowing researchers and managers to detect changes and trends over time.
High-resolution satellite images can be used to monitor a wide range of forest characteristics, including tree cover, canopy density, and species composition. This information can be used to track the impact of human activities, such as logging and land use change, on forests, as well as the effects of natural disturbances, such as fires and storms.
In addition to providing valuable information about the state of forests, high-resolution satellite imagery can also be used to support a range of other forest management activities, such as planning and implementing conservation and restoration efforts. By providing detailed, up-to-date information about forests, satellite imagery can help managers make more informed decisions and take more effective actions to protect and preserve these important ecosystems.
Our offer
The use of high-resolution satellite imagery is the most valuable tool in the practice of forest monitoring. By providing detailed, up-to-date information about the state of forests, this technology can help researchers and managers better understand and manage these important ecosystems.
Advanced algorithms allow differentiation between forest areas and crops; between cuts; and between weather phenological events such as drought. We describe the following algorithms below:
- Normalized Difference Vegetation Index (NDVI)
- Forest Canopy Density Model (FCD)
- Barren Soil Index (BSI)
We provide this information to our customers on-demand for the areas of interest.
Remote Sensing Method
The plants absorb solar radiation and reflect themselves light in several bandwidths, mainly depending on the plant type, chlorophyll content, sugar content, and water content within tissues. The spectral reflectance response is captured by the satellite and allows spectral analysis to compute several indexes used to determine plant growth and health and also to classify different land covers: forest, crops, pasture, bare soil, water surfaces, buildings, etc.
Combining several indexes allows for enhancing the characteristics of some crops while reducing others.
The main spectral wavelength which are relevant for computing the vegetation indexes are:
Visible
- Blue: 0.45 - 0.495 μm
- Green: 0.495 - 0.57 μm
- Red: 0.62 - 0.75 μm
InfraRed (IR)
- Near InfraRed (NIR): 0.75 - 0.9 μm
- Short Wave InfraRed (SWIR): 0.9 - 3 μm
- Thermal InfraRed (TIR): 3 - 14 μm
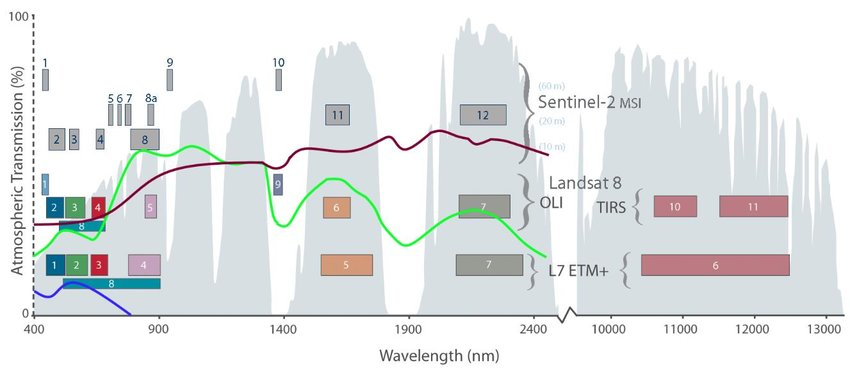
Different satellites use different wavelengths within these bands. In our examples below, we’ll mainly use the Sentinel 2 wavelengths.
Launched on June 2015, this satellite is equipped with an optoelectronic MultiSpectral Instrument (MSI) able to provide 10-60 m resolution data in 13 spectral channels from a 785km height orbit every 2-3 days at middle latitudes (e.g., Romania) under cloud-free conditions.
The Landsat 8 satellite from NASA has 11 channels, and Sentinel 2 from ESA has 13 channels; their correspondence is shown in the figure below.
For monitoring forest loss and gain, we are using three methods, all of them based on spectral analysis of satellite images: the NDVI analysis, Forest Canopy Density estimation, and Baren soil index analysis.
Normalized Difference Vegetation Index (NDVI)
Forest monitoring is based on a complex process of computation of NDVI - Normalized difference vegetation index) - from very high-resolution satellite images over a long period.
For accurate computation, only cloud-free zones are taken into account.
Statistics based on current data are compared to statistics computed in the same area in the past.
The Chlorophyll, giving the plant’s leaves the green color, absorbs from solar radiation the visible wavelengths needed for photosynthesis and reflects Near InfraRed (NIR, 0.835μm). The health of the plant can be estimated by comparison between NIR and Red wavelengths, the level of health being proportional to the emission of NIR wavelength.
In order to quantify the green vegetation, the most effective index is NDVI which normalizes the green leaf diffusion in NIR wavelengths with chlorophyll absorption in Red (0.665μm) wavelengths. The resolution for these channels is 10m for Sentinel 2. This can be easily understood by analyzing the spectral signatures of vegetation (in green), soil (red), and water (blue) in the image above.
With values between -1 and 1, the NDVI can describe the soil coverage as follows:
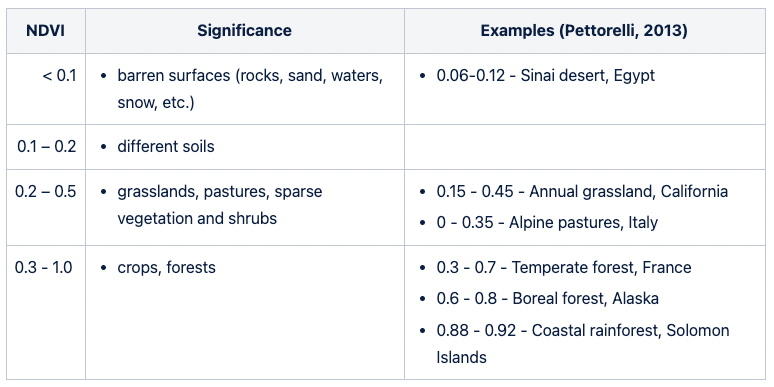
NDVI is mainly used for monitoring forest and global vegetation disturbances, taking care of its few weaknesses:
- sensitivity to cloud shadow and leaf canopy shadow
- due to its non-linearity, NDVI reaches saturation in dense vegetation
Forest Canopy Density Model (FCD)
FCD is one of the most effective methods to detect and estimate the canopy density over a large area in a reduced time and with lower costs.
Forest canopy is the proportion of the forest floor covered by the vertical projection of the tree crowns. Wildfires and anthropogenic intervention in the natural forest reduce the number of trees per unit area, and canopy closure and monitoring the density changes have a crucial role in the planning of implementation of rehabilitation programs.
FCD computes canopy density as a percentage for each pixel based on the following three indices:
- Advance Vegetation Index (AVI) - highlights the differences in canopy density being more sensitive than classical NDVI
- Bare Soil Index (BI) - enhance the response of bare soil areas and fallow lands.
- Canopy Shadow Index (SI) - corrects the shadow pattern due to crown arrangement, which affects the spectral response.
This method classifies the forest canopy into 5 categories:
- High Forest Canopy Density (71 - 100%)
- High Forest Canopy Density (41 - 70%)
- Low Forest Canopy Density (5 - 40%)
- Grass Land
- Bare Soil
The checked accuracy of this method is 84%, and it's very useful for analyzing deforestation or conversion from native forests to plantations.
Barren Soil Index
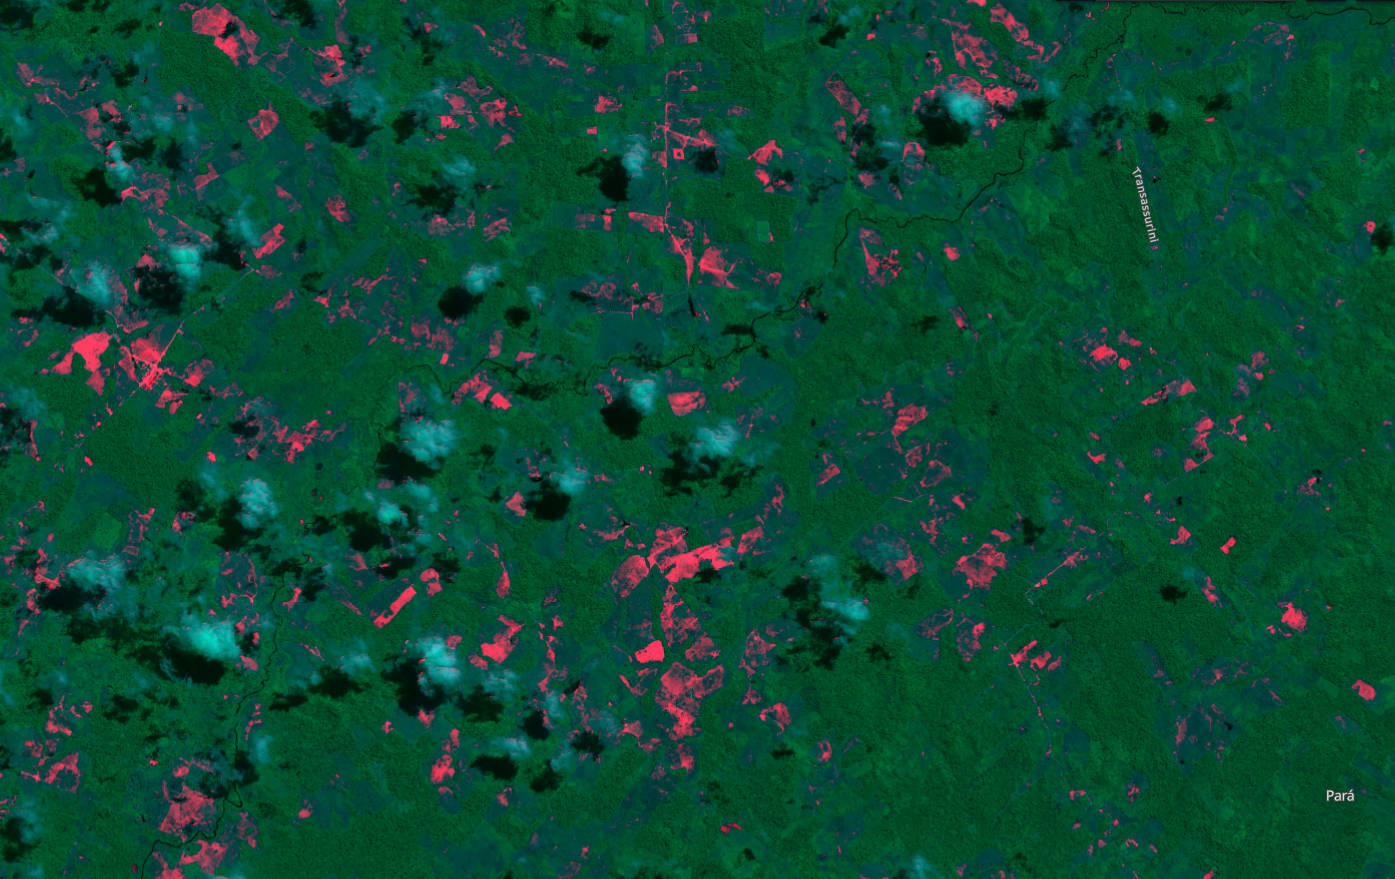
In this image, the deforested surfaces appear in red, vegetation in green, and waters and cloud shadows in black. This can be used for monitoring ongoing deforestation and droughts.
Satellite imagery is a type of remotely-sensed data that is collected by sensors mounted on satellites orbiting the Earth. High-resolution satellite imagery has a high level of detail and can be used to identify changes in the landscape over time. In the case of Amazon deforestation, high-resolution satellite imagery can be used to monitor the extent and rate of deforestation and to identify areas that are at risk of being cleared.
There are several organizations and initiatives that use high-resolution satellite imagery to monitor Amazon deforestation. For example, the Amazon Environmental Research Institute (IPAM) uses satellite data to track deforestation in the Brazilian Amazon, and the Global Forest Watch (GFW) platform uses satellite data to monitor forest cover and deforestation worldwide. These and other initiatives provide valuable information about the state of the Amazon and help inform efforts to protect and manage the forest.